

Graph is a branch of mathematics that can be applied in everyday life, graph theory can solve many existing problems (Ramadhan et al., 2018).
Graph is used for various disciplines and daily life. Graph is used in various fields (chemistry, ecology, genetics, sports, transportation, cartography, and computer networks) to model problems (Didiharyono & Soraya, 2018) and (Rahadi, 2019).
Problems that can be solved using graph data are:
- Travelling Salesman
- Minimum Spanning Tree Problem
- Shortest path problem
- Coloring
1. Travelling Salesman#
To determine the minimum possible travel time for a salesman.
Problem:#
Every week once, a telephone office officer goes around to collect coins from public telephones installed in various places. Starting from his office, he visits one by one the public telephones and finally returns to the office again. The problem is he wants a travel route with minimal time.
Graph Model#
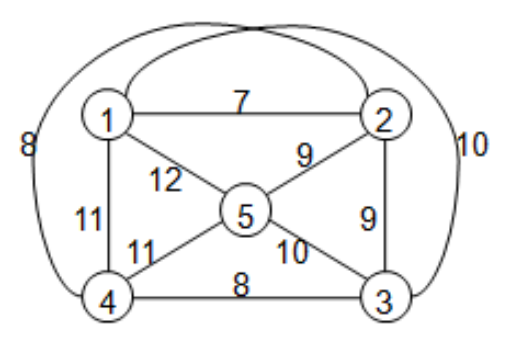
For example#
The central office is node 1 and suppose there are 4 public telephones, which we denote as nodes 2, 3, 4 and 5 and the numbers on each edge indicate the travel time (in minutes) between 2 nodes.
Solution steps:#
- Start from the node that is likened to the central office, namely node 1
- From node 1 choose the edge that has the minimal time.
- Do it continuously on the other nodes exactly once which will form a closed graph because the journey will return to the central office.
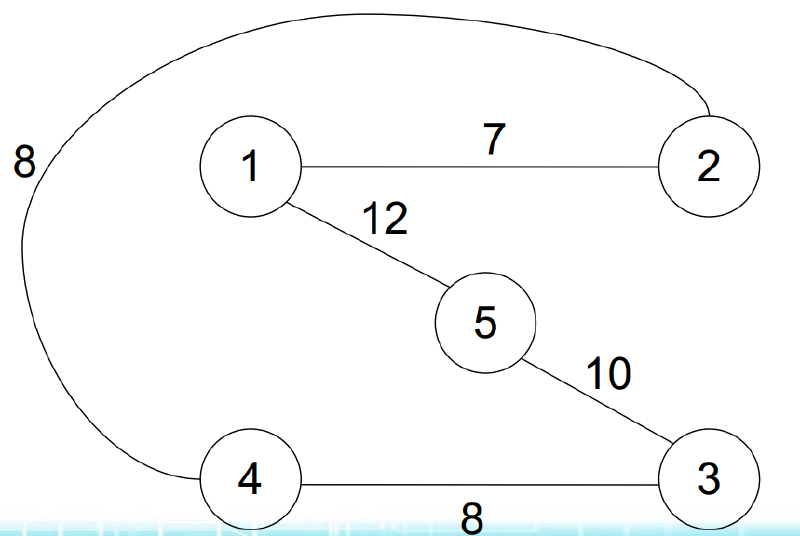
- The above problem produces a minimum time of 45 minutes and the obtained journey is as follows:
The above problem produces a minimum time of 45 minutes and the obtained journey is as follows:
2. Minimum Spanning Tree#
MST Problem Case#
Finding the minimum cost spanning tree from each edge of the graph that forms a tree.
Solution to this problem:#
- By selecting an edge of a graph that meets the criteria of optimization that produces minimum cost.
- Addition of each edge to all edges that form the graph will produce a small (minimum cost) value/cost.
Criteria for Minimum Spanning Tree, namely:#
- Each edge in the graph must be connected
- Each edge in the graph must have a value (graph label)
- Each edge in the graph must not have direction (undirected graph)
The process of total minimum cost forming the graph with the following stages:#
- From the formed graph, does it meet the MST criteria.
- Do it in order from the initial edge to the final edge
- At each edge node pay attention to the value/cost of each edge
- Take the smallest value (shortest distance of each edge).
- Continue until all edge nodes are depicted on the spanning tree
- Sum the selected value/cost.
Criteria:
√ connected graph
√ undirected graph
√ graph has label
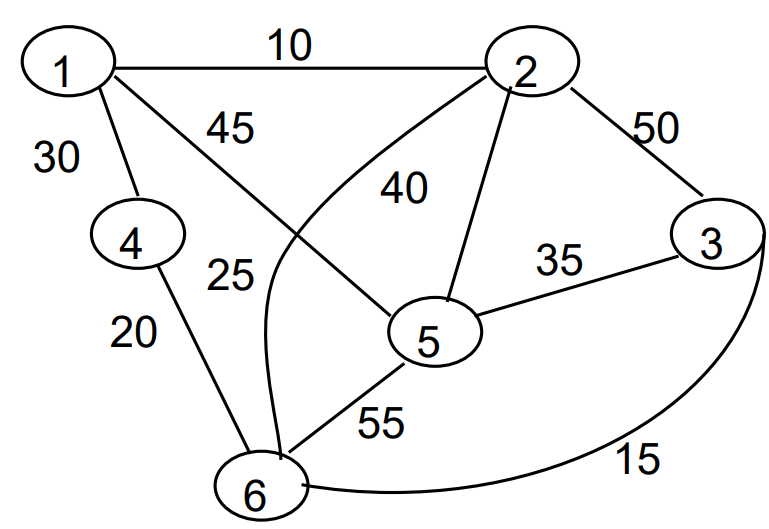
Determine the MST value from the graph above and determine the edges that form the MST
MINIMUM SPANNING TREE Solution Pay attention to MST criteria, namely:#
- The graph is already a connected graph
- The graph is an undirected graph
- Each edge has a label
Calculate MST from each edge that forms the graph by:#
a. Done in order from the first edge to the last edge.
b. Each edge must be depicted on the spanning tree formed.
Stages of the Solution Process from edge, Cost and spanning tree#
| Edge | Cost | Spanning Tree |
|---|---|---|
| (1,2) | 10 |  |
| (2,6) | (25) | 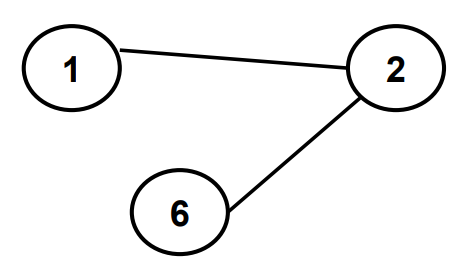 |
| (3,6) | 15 | 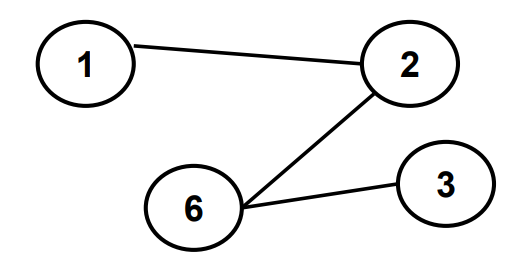 |
| (4,6) | 20 | 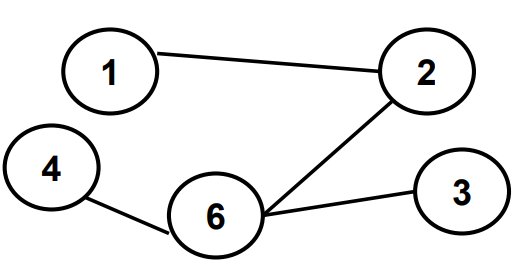 |
| (3,5) | 35 | 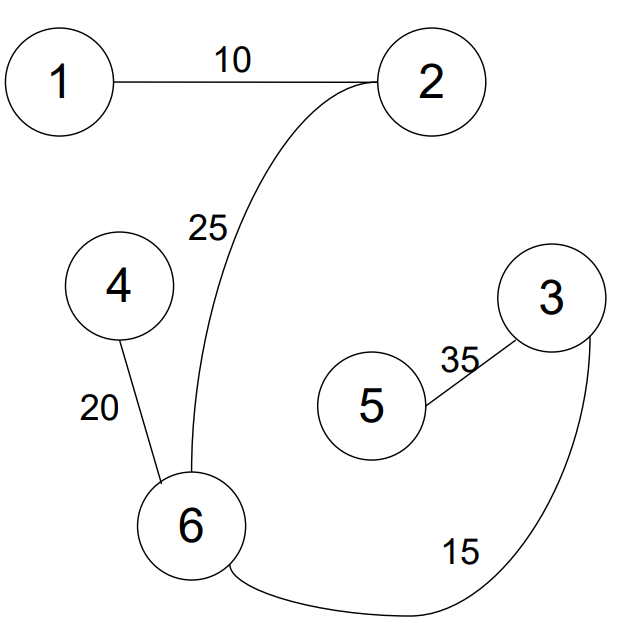 |
| Total Cost | 105 |
3. Shortest Path Problem#
Problem: Calculate the shortest path from a directed graph.
Criteria for the Shortest Path problem:#
- Each edge in the graph must have a value (graph label)
- Each edge in the graph does not have to be connected (unconnected)
- Each edge in the graph must have direction (directed graph).
- Calculate the distance one by one according to the direction indicated by each edge.
- Calculation is done on the graph edges that have initial and final paths.
Solution#
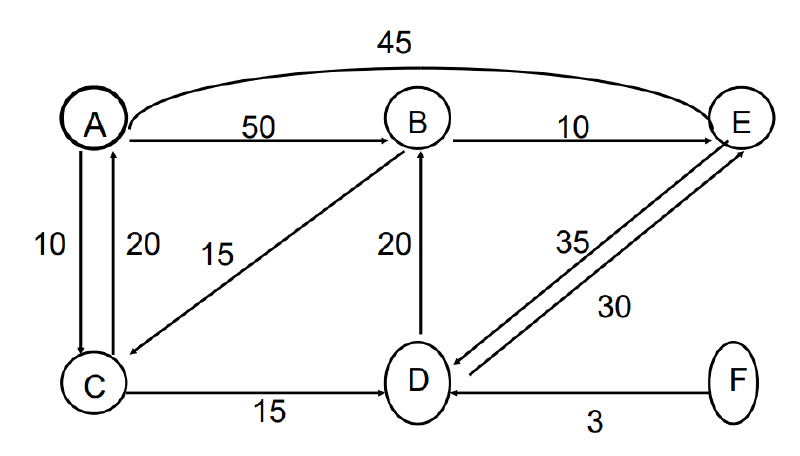
- First: Look at the process of nodes that have initial and final destinations from the graph, namely: A – B, A – C, A – D, A – E
- Second: Find the shortest path from each of the four paths by calculating the length of each path.
Step 1 Solution Path A - B#
- A -B = 50
- A -C - D- B = 10 + 15 + 20 = 45
- A - E - D - B = 45 + 35 + 20 = 100
The shortest path for node A destination B is:
A – C – D – B = 45
Step 2 Solution Path A - C#
- A – C = 10
- A – B – C = 50 + 15 = 65
- A – B – E – D – B – C = 50 + 10 + 35 + 20 + 15 = 130
- A – E – D – B – C = 45 +35 +20 + 15 = 115
The shortest path for node A destination C is:
A – C = 10
Step 3 Solution Path A - D#
- A – C – D = 10 + 15 = 25
- A – B – E – D = 50 + 10 + 35 = 95
- A – B – C – D = 50 + 15 + 15 = 80
- A – E – D = 45 + 35 = 80
The shortest path for node A destination D is:
A – C – D = 25
Step 4 Solution Path A - E#
- A – E = 45
- A – B – E = 50 + 10 = 60
- A – C – D – B – E = 10 + 15 + 20 + 10 = 55
- A – C – D – E = 10 + 15 + 30 = 55
The shortest path for node A destination E is
A – E = 45
SHORTEST PATH PROBLEM Table#
| Path | Distance Length |
|---|---|
| A – C | 10 |
| A – C – D | 25 |
| A – C – D – B | 45 |
| A – E | 45 |
4. Coloring#
Coloring Problem#
- The problem of giving color to all nodes, such that 2 (two) adjacent nodes (there is an edge connecting the two nodes) have different colors.
- The number of colors used is requested to be as minimal as possible
Example 1: Traffic Light Pattern#
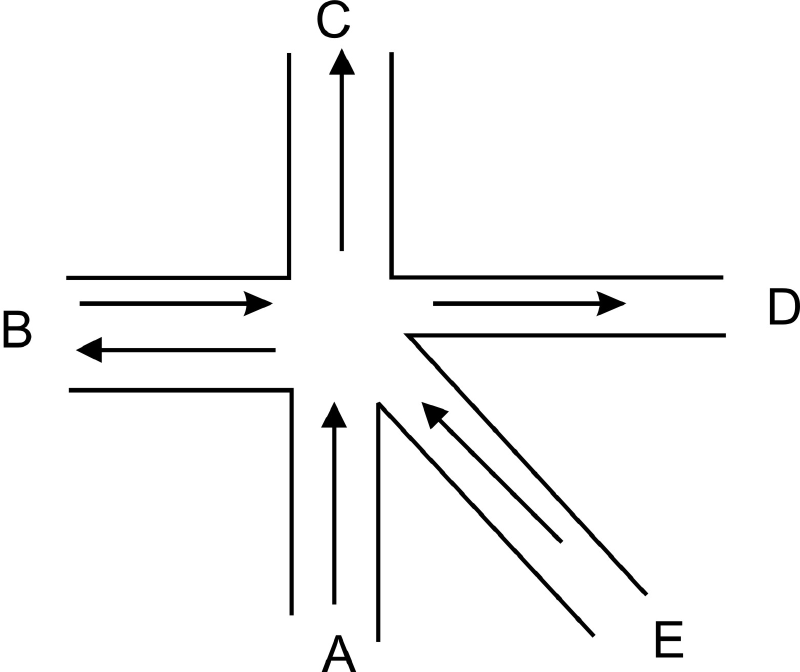
Problem:#
Determine the traffic light pattern with minimal number of phases, and in each phase there is no crossing travel. The allowed travels are:
A to B, A to C, A to D, B to C, B to D, E to B, E to C and E to D
Problem solving steps#
- Determine the nodes from the allowed travels (for placing nodes freely)
- Determine edges to connect 2 nodes that state 2 travels that cross each other
- Give color to each node with new colors.
- If nodes are adjacent then give different colors
- If nodes are not adjacent then give the same color
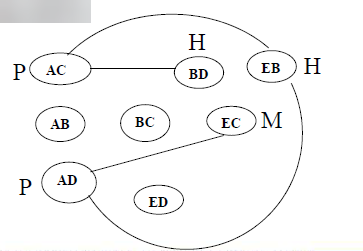
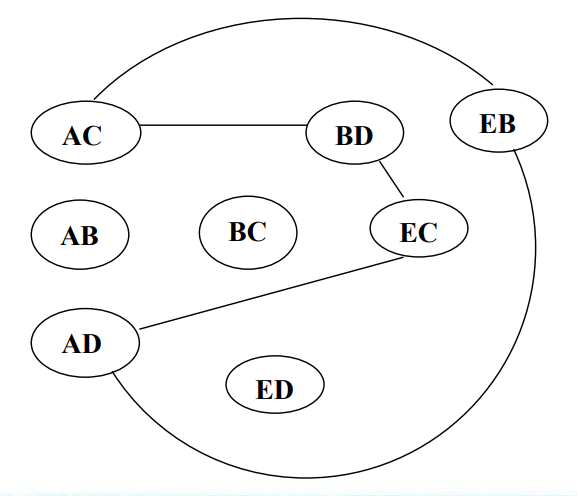
- We see that nodes AB, BC and ED are not connected by an edge so for those nodes never cross other travels and those nodes always have green lights
- Determine the division of each node that has been colored.
White = ( AC, AD )
Black = ( BD, EB )
Red = ( EC )
Note: Division of nodes based on nodes that are not directly related as minimal as possible (CAN BE DONE WITH SEVERAL POSSIBILITIES)
- From step 5 obtained 3 phases, so we can conclude the overall situation and the results can be stated as:
Phase 1
| Lamp Status | Path |
|---|---|
| GREEN | AC, AD, AB, BC, ED |
| RED | BD, EB, EC |
Phase 2
| Lamp Status | Path |
|---|---|
| GREEN | BD, EB, AB, BC, ED |
| RED | AC, AD, EC |
Phase 3
| Lamp Status | Path |
|---|---|
| GREEN | EC, AB, BC, ED |
| RED | AC, AD, BD, EB |
Example 2: Exam Scheduling Table#
| MHS | A | B | C | D | E | F |
|---|---|---|---|---|---|---|
| 1 | 0 | 1 | 0 | 0 | 1 | 0 |
| 2 | 0 | 0 | 1 | 1 | 0 | 0 |
| 3 | 1 | 0 | 0 | 0 | 1 | 0 |
| 4 | 1 | 0 | 0 | 0 | 0 | 1 |
| 5 | 0 | 1 | 0 | 1 | 0 | 0 |
| 6 | 0 | 1 | 1 | 0 | 0 | 0 |
| 7 | 1 | 0 | 0 | 0 | 0 | 1 |
| 8 | 0 | 0 | 1 | 1 | 0 | 0 |
Exam Scheduling Table Explanation
- 6 columns symbolized by letters indicate course names.
- 8 rows indicated by numbers are students.
- Number “1” in the table indicates the course taken.
- Number “0” in the table means the course not taken.
Exam Scheduling Table Problem#
- There are students who take two courses at once.
- The schedule maker team must make a schedule that fits so that student exam schedules do not clash.
- Condition: no student may take two exams at the same time.
Exam Scheduling Table Problem Solution#
- Depict nodes that indicate courses.
- Make edges or connecting lines stating there are students who choose both courses.
- Choose nodes with the same color, nodes with the same color indicate there are no students taking those courses simultaneously, meaning they can be scheduled at the same time.
Exam Scheduling Table Node Image#
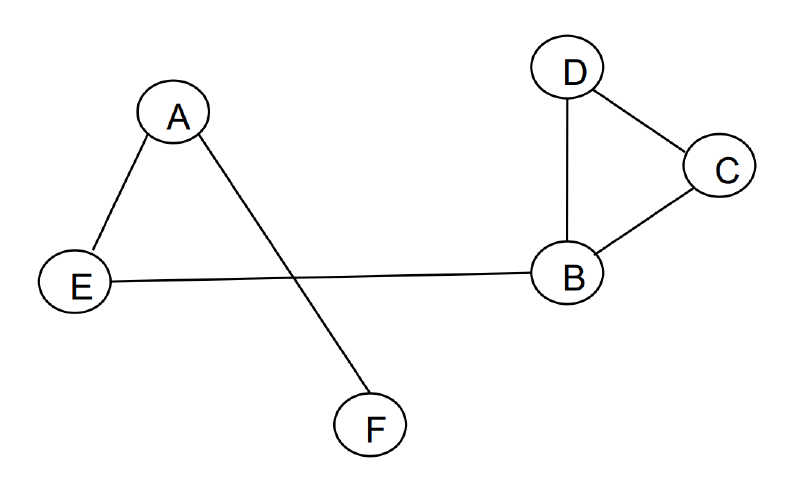
Graph Explanation From Exam Scheduling Table#
- If there are two nodes connected by an edge, then the exams of the two courses cannot be made at the same time.
- Give color to each node, if different colors are given to nodes that indicate different exam times.
- The colors used must be as minimal as possible.
- Note: Adjacent nodes must not have the same color.
Graph Result From Exam Scheduling Table with Color#
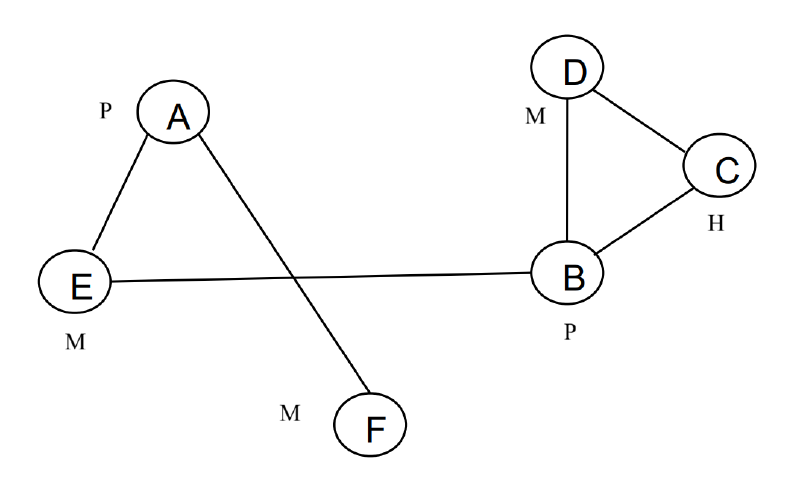
Explanation:
P -> White
M -> Red
H -> Green
Colored Graph Explanation#
- Red color: for nodes F, E, D
- White color: for nodes A, B,
- Green color: for node C (because adjacent)
- Node C neighbors with node B (white color), and node D (red color) so C must be given a different color.
Colored Graph Explanation from Exam Scheduling Table#
Group nodes with the same color, the same color means they can be scheduled for exams so the results are as follows:
- Red nodes = F, E, D
- White nodes = A, B
- Green node = C
Note:
- For node placement position, it can be free
- Initial color assignment can be free
- Colors used are free
- Initial color assignment affects the schedule arrangement