
Definition#
An entity relationship is a network that uses the arrangement of data stored by a system in an abstract manner. The entity-relationship model consists of entities and relationships between those entities.
Symbols in E-R Diagram#
| Notation | Meaning |
|---|---|
 | Entity |
 | Weak Entity |
 | Relationship |
 | Identifying Relationship |
 | Derived Attribute |
 | Attribute |
 | Primary Key Attribute |
 | Multivalue Attribute |
 | Composite Attribute |
Components of an E-R Diagram#
- Entity is a collection of objects or something that can be distinguished or uniquely identified. A collection of similar entities is called an entity set.
- Relationship is the connection that occurs between one or more entities.
- Attribute is a collection of data elements that form an entity.
- A type indicator is divided into two types:
- Associative object type indicator
- Supertype type indicator
Entity Set#
Entity Sets are divided into:
- Strong entity set is an entity set whose one or more attributes are used by other entity sets as keys. It is depicted as a rectangle.
Example: E is an entity set with attributes a1, a2,..,an, then that entity set is represented as table E with n columns, where each column corresponds to its attributes. - Weak entity set is an entity set that depends on a strong entity set. It is depicted as stacked rectangles.
Example: A is a weak entity set with attributes a1, a2, .., ar and B is a strong entity set with attributes b1, b2,..,bs, where b1 is the primary key attribute. Then the weak entity set is represented by table A with attributes {b1} ∪ {a1,a2,.., ar}.
graph LR
%% Employee Attributes
A1(["EMP_ID"])
A2(["........"])

    %% Strong Entity
    E1["EMPLOYEE"]

    %% Identifying Relationship
    R1{"OWNS"}

    %% Weak Entity (Using double-border / Subroutine shape)
    E2[["DEPENDENT"]]

    %% Dependent Attributes (Partial Key with dashed line)
    A3(["NAME
╌╌╌╌╌"])
    A4(["........"])

    %% Connecting Lines
    A1 --- E1
    A2 --- E1
    E1 --- R1

    %% Double line (Total Participation) from relationship to weak entity
    R1 === E2

    E2 --- A3
    E2 --- A4
Example: Strong entity set
| EMP_ID | NAME |
|---|---|
| 200107340 | BILLY |
| 200307569 | FUAD |
| 200107341 | NINING |
| 200107486 | FINTRI |
Weak entity set example
| EMP_ID | DEPENDENT | BIRTH DATE | GENDER |
|---|---|---|---|
| 200107340 | HAFIDZ | 22-03-2006 | MALE |
| 200307569 | RENI | 13-05-1999 | FEMALE |
| 200107341 | RAFFA | 21-06-2006 | MALE |
| 200107486 | NAIA | 25-10-2006 | FEMALE |
Types of Attributes#
- KEY -> attribute used to uniquely determine an entity
- SIMPLE ATTRIBUTE → attribute that has a single value
- MULTI VALUE ATTRIBUTE → attribute with a set of values for each entity instance
In the diagram below, the key attribute is EMP_ID. Birth Date and Name are simple attributes. Degree is an example of a multivalue attribute.
graph BT
%% Attribute Definitions
A1(["BIRTH DATE"])
A2((("DEGREE")))
A3(["EMP_ID"])
A4(["NAME"])

    %% Entity Definition
    E1["EMPLOYEE"]

    %% Connect Entity with Attributes (BT: Bottom to Top)
    A1 --- E1
    A2 --- E1
    A3 --- E1
    A4 --- E1
- COMPOSITE ATTRIBUTE -> An attribute that consists of several smaller attributes with specific meaning, for example an employee name attribute consisting of first name, middle name, and last name.
graph BT
%% Entity Definition
E1["EMPLOYEE"]

    %% Composite Attribute Definition
    A1(["NAME"])

    %% Sub-attributes (Simple Attributes)
    A11(["NAME
FIRST"])
    A12(["NAME
MIDDLE"])
    A13(["NAME
LAST"])

    %% Connect Entity with Composite Attribute (BT: Bottom to Top)
    A1 --- E1

    %% Connect Composite Attribute with Its Sub-attributes
    A11 --- A1
    A12 --- A1
    A13 --- A1
- DERIVED ATTRIBUTE → An attribute that is derived from another attribute. For example, Age is calculated from Birth Date and the current date. Therefore, the existence of the Age attribute depends on the existence of the Birth Date attribute.
graph BT
%% Entity Definition
E1["EMPLOYEE"]

    %% Basic Attribute Definition (Simple Attribute)
    A1(["BIRTH DATE"])

    %% Derived Attribute Definition
    A2(["AGE"])

    %% Connect Entity and Attributes
    A1 --- E1
    A2 --- A1

    %% Styling (Dashed line for Derived Attribute)
    classDef derived stroke-dasharray: 2 2;

    class E1 entity;
    class A1 attribute;
    class A2 derived;
Mapping Cardinality#
The number of entities that correspond to other entities through relationships.
Types of mapping:
- One to one
- Many to one or one to many
- Many to many
Representation of Entity Set
Entity sets are represented as tables with unique names. Each table consists of a number of columns, and each column has a unique name.
Cardinality Ratio Constraint: explains the limits on how many connections one entity has with another entity. Cardinality ratio types = 1:1, 1:N / N:1, M:N
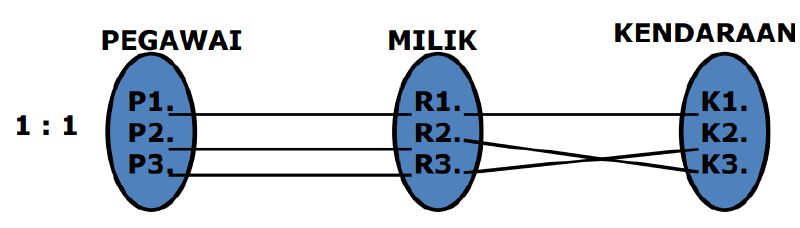
graph LR
%% Entity and Relationship Definitions
E1["EMPLOYEE"]
R1{"OWNS"}
E2["VEHICLE"]

    %% Connecting lines with cardinality (1 : 1)
    E1 ---|1| R1
    R1 ---|1| E2
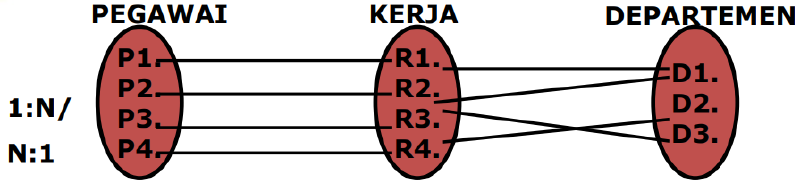
graph LR
%% Entity and Relationship Definitions
E1["EMPLOYEE"]
R1{"WORKS"}
E2["DEPARTMENT"]

    %% Connecting lines with cardinality (1 : 1)
    E1 ---|1| R1
    R1 ---|1| E2
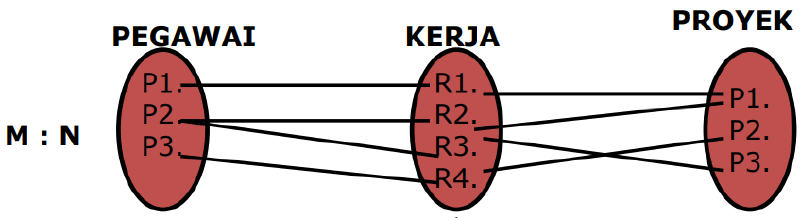
graph LR
%% Entity and Relationship Definitions
E1["EMPLOYEE"]
R1{"WORKS"}
E2["PROJECT"]

    %% Connecting lines with cardinality (M : N)
    E1 ---|M| R1
    R1 ---|N| E2
Cardinality 1:1, 1:M, M:N
One-To-One:
graph LR
%% Entity Definitions
H[Husband]
W[Wife]

    %% Two-way relationship (Double-headed arrow)
    H <--> W
One-To-Many:
graph TD
%% Main Entity Definition
C[Customer]

    %% Child Entities
    O1[Order
1]
    O2[Order
2]
    O3[Order
3]

    %% Relationship connecting lines
    C --- O1
    C --- O2
    C --- O3
Many-To-Many:
graph TD
%% Class Entities (Top)
C1[CLASS
1]
C2[CLASS
2]

    %% Student Entities (Bottom)
    SA[STUDENT
A]
    SB[STUDENT
B]
    SC[STUDENT
C]

    %% Relationship connecting lines (Many to Many)
    C1 --- SA
    C1 --- SB
    C1 --- SC

    C2 --- SA
    C2 --- SB
    C2 --- SC
ORDER: #, DATE, PART #, QUANTITY
PART: #, DESCRIPTION, UNIT PRICE, SUPPLIER #
SUPPLIER: #, NAME, ADDRESS
graph TD
%% Entity Definitions (Boxes)
E1["ORDER"]
E2["PART"]
E3["SUPPLIER"]

    %% Relationship Definitions (Diamonds)
    R1{"CAN HAVE"}
    R2{"CAN HAVE"}

    %% Connection lines and cardinality
    E1 ---|1| R1
    R1 ---|M| E2

    E2 ---|M| R2
    R2 ---|1| E3
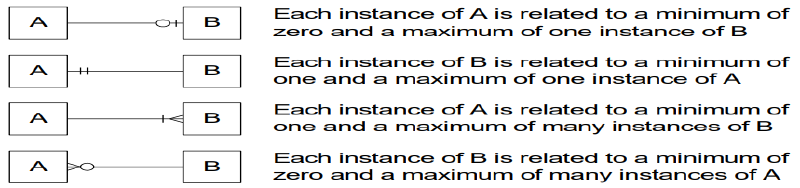
Participation Constraint#
Explains whether the existence of an entity depends on its relationship with another entity.
There are two types of participation constraint:
- Total participation constraint: The existence of an entity depends on its relationship with another entity. In the ER diagram this is shown by a double line between the entity and relationship.
- Partial participation: The existence of an entity does not depend on the relationship with another entity. In the ER diagram this is shown by a single line.
Participation Constraint Example#
a. TOTAL PARTICIPATION
graph LR
%% Entity and Relationship Definitions
E1["EMPLOYEE"]
R1{"HAS"}
E2["DEPARTMENT"]

    %% Connecting lines with cardinality
    E1 ---|N| R1
    R1 ---|1| E2
b. PARTIAL PARTICIPATION
graph LR
%% Entity and Relationship Definitions
E1["EMPLOYEE"]
R1{"WORKS"}
E2["PROJECT"]

    %% Connecting lines with cardinality
    E1 ---|M| R1
    R1 ---|1| E2
Type Indicator#
The associative object type indicator functions as both an object and a relationship.
graph LR
%% Entity and Relationship Definitions
E1["STUDENT"]
R1{"ENROLLS"}
E2["COURSE"]

    %% Connecting lines
    E1 --- R1
    R1 --- E2
Becomes
graph TD
%% Entity Definitions (Boxes)
E1[STUDENT]
E2[COURSE]
E3[ENROLLMENT]

    %% Relationship Definition (Empty Diamond)
    R1{" "}

    %% Connecting lines
    E1 --- R1
    E2 --- R1
    R1 --- E3
The supertype type indicator consists of an object and one or more subcategories connected by an unnamed relationship.
graph TD
%% Supertype Entity (Parent)
E1["EMPLOYEE"]

    %% Relationship Symbol (IS-A)
    R1{" "}

    %% Subtype Entities (Children)
    E2["CONTRACT
EMPLOYEE"]
    E3["REGULAR
EMPLOYEE"]

    %% Connecting lines
    E1 --- R1
    R1 --- E2
    R1 --- E3
ERD Creation Steps#
- Identify and determine all entity sets that will be involved.
- Determine the key attributes of each entity set.
- Identify and determine all relationship sets between existing entity sets along with their foreign keys.
- Determine the degree/cardinality of relationships for each relationship set.
- Complete the entity sets and relationship sets with non-key attributes.
Logical Record Structured (LRS)#
LRS -> representation of the record structure of tables formed from relationships among entity sets.
Determining Cardinality, Number of Tables and Foreign Key (FK)
One to One (1-1)
graph LR
%% Entity and Relationship Definitions
E1["DRIVER"]
R1{"DRIVES"}
E2["TAXI"]

    %% Connecting lines with cardinality (1 : 1)
    E1 --- R1
    R1 --- E2
The diagram above shows a 1-1 cardinality relationship because:
one driver can only drive one taxi, and
one taxi can only be driven by one driver.
A 1-1 relationship will form 2 tables:
Driver table (driver_id, name, address)
Taxi table (taxi_id, license_plate, brand, type)
The LRS formed is as follows:
erDiagram
%% Relationship Definition (Primary Key to Foreign Key)
DRIVER ||--o{ TAXI : ""

    %% Table Structure 1 (Left)
    DRIVER {
        string driver_id PK "Primary Key"
        string name
        string address
    }

    %% Table Structure 2 (Right)
    TAXI {
        string taxi_id PK "Primary Key"
        string license_plate
        string brand
        string type
        string driver_id FK "Foreign Key"
    }
or
erDiagram
%% Relationship Definition (Primary Key to Foreign Key)
TAXI ||--o{ DRIVER : ""

    %% Table Structure 1 (Left)
    TAXI {
        string taxi_id PK "Primary Key"
        string license_plate
        string brand
        string type
    }

    %% Table Structure 2 (Right)
    DRIVER {
        string driver_id PK "Primary Key"
        string name
        string address
        string taxi_id FK "Foreign Key"
    }
One to Many (1-M)
graph LR
%% Entity and Relationship Definitions
E1["DOSEN"]
R1{"MENGAWASI"}
E2["KELAS"]

    %% Connecting lines with cardinality
    E1 --- R1
    R1 --- E2
The diagram above shows a 1-M cardinality relationship because:
one dosen can supervise many kelas, and
one kelas is supervised by one dosen.
A 1-M relationship will form 2 tables:
Dosen table (lecturer_id, name, address)
Kelas table (class_id, major, semester, student_count)
erDiagram
%% Definisi Relasi (Primary Key ke Foreign Key)
DOSEN ||--o{ KELAS : ""

    %% Struktur Tabel 1 (Kiri)
    DOSEN {
        string lecturer_id PK "Primary Key"
        string name
        string address
    }

    %% Struktur Tabel 2 (Kanan)
    KELAS {
        string class_id PK "Primary Key"
        string major
        string semester
        string student_count
        string lecturer_id FK "Foreign Key"
    }
Many to Many (M-M)
graph LR
%% Entity and Relationship Definitions
E1["STUDENT"]
R1{"TAKES"}
E2["COURSE"]

    %% Connecting lines with cardinality
    E1 --- R1
    R1 --- E2
The diagram above shows an M-M cardinality relationship because:
one student can take many courses, and
one course can be taken by many students.
An M-M relationship will form 3 tables:
Student table (student_id, name, address)
Course table (course_code, course_name, credits)
Grade table (student_id, course_code, grade) -> using a composite key
The LRS formed is as follows:
erDiagram
%% Relationship Definition (Primary Key to Foreign Key)
STUDENT ||--o{ GRADE : ""
COURSE ||--o{ GRADE : ""

    %% Student Table Structure
    STUDENT {
        string student_id PK "Primary Key"
        string name
        string address
    }

    %% Grade Table Structure (Junction Table)
    GRADE {
        string student_id PK,FK "Composite PK"
        string course_code PK,FK "Composite PK"
        string grade
    }

    %% Course Table Structure
    COURSE {
        string course_code PK "Primary Key"
        string course_name
        string credits
    }
Example Case#
A company has several departments. Each department has a supervisor and at least one employee. Employees must be assigned to at least one department, but can also be assigned to multiple departments. At least one employee is assigned to a project. However, an employee may be off duty and not assigned to any project.
Solution#
Step 1: Determine Entities#
The required entities are: Department, Employee, Supervisor, and Project.
Step 2: Determine Relationships with a relationship matrix#
| Department | Employee | Supervisor | Project | |
|---|---|---|---|---|
| Department | assigned to | managed by | ||
| Employee | belongs to | works on | ||
| Supervisor | supervises | |||
| Project | uses |
Step 3: Draw the preliminary ERD#
flowchart TD
%% Entity Definitions (Boxes)
B[Department]
Pw[Supervisor]
Pg[Employee]
Pr[Project]

    %% Relationship Definitions (Diamonds)
    R1{managed by}
    R2{assigned to}
    R3{works on}

    %% Connecting lines (Layout)
    B --- R1 --- Pw
    B --- R2 --- Pg
    Pg --- R3 --- Pr
Problem description:
- Each department has only one supervisor
- Each supervisor is assigned to only one department
- Each department has at least one employee
- Each employee works for at least one department
- Each project is worked on by at least one employee
- A supervisor can be assigned to zero or several projects
Step 4: Fill in cardinalities#
flowchart TD
%% Entity Definitions (Boxes)
B[Department]
Pw[Supervisor]
Pg[Employee]
Pr[Project]

    %% Relationship Definitions (Diamonds)
    R1{managed by}
    R2{assigned to}
    R3{works on}

    %% Connecting lines with cardinality
    B ---|1| R1 ---|1| Pw
    B ---|M| R2 ---|M| Pg
    Pg ---|M| R3 ---|M| Pr
Step 5: Determine Primary Keys#
Primary keys: Department Name, Supervisor Number, Employee Number, Project Number.
Step 6: Draw the ERD based on keys#
Because there are two many-to-many relationships in the preliminary ERD, namely between Department and Employee, and between Employee and Project, new entities are created: Department-Employee and Employee-Project. The primary key of Department-Employee is the combination of Department Name and Employee Number. The primary key of Employee-Project is the combination of Employee Number and Project Number.
Step 7: Determine the required attributes#
flowchart TB
%% Attributes (Oval shapes)
A_DepartmentName(["Department_Name"])
A_SupervisorNumber(["Supervisor_Number"])
A_SupervisorName(["Supervisor_Name"])
A_DepartmentNameDE(["Department_Name"])
A_EmployeeNumberDE(["Employee_Number"])
A_EmployeeNumber(["Employee_Number"])
A_EmployeeName(["Employee_Name"])
A_ProjectNumber(["Project_Number"])
A_ProjectName(["Project_Name"])
A_EmployeeNumberEP(["Employee_Number"])
A_ProjectNumberEP(["Project_Number"])

    %% Entities (Rectangles)
    E_Department["Department"]
    E_Supervisor["Supervisor"]
    E_DepartmentEmployee["Department-Employee"]
    E_Employee["Employee"]
    E_Project["Project"]
    E_EmployeeProject["Employee-Project"]

    %% Relationships (Diamonds)
    R_managed{"managed by"}
    R_assigned{"assigned to"}
    R_involved{"involved in"}
    R_works1{"works on"}
    R_works2{"works on"}

    %% Connect Entities to Attributes
    A_DepartmentName --- E_Department
    E_Supervisor --- A_SupervisorNumber
    E_Supervisor --- A_SupervisorName
    E_DepartmentEmployee --- A_DepartmentNameDE
    E_DepartmentEmployee --- A_EmployeeNumberDE
    A_EmployeeNumber --- E_Employee
    A_EmployeeName --- E_Employee
    A_ProjectNumber --- E_Project
    A_ProjectName --- E_Project
    E_EmployeeProject --- A_EmployeeNumberEP
    E_EmployeeProject --- A_ProjectNumberEP

    %% Connect Entities to Relationships with Cardinality
    E_Department ---|1| R_managed ---|1| E_Supervisor
    E_Department ---|1| R_assigned ---|M| E_DepartmentEmployee
    E_DepartmentEmployee ---|M| R_involved ---|1| E_Employee
    E_Employee ---|1| R_works1 ---|M| E_EmployeeProject
    E_Project ---|1| R_works2 ---|M| E_EmployeeProject
The LRS formed:
classDiagram
direction LR

    class Department {
        Department Name [PK1]
    }

    class Supervisor {
        Supervisor Number [PK1]
        Supervisor Name
    }

    class `Department-Employee` {
        Department Name [PK1][FK]
        Employee Number [PK1][FK]
    }

    class Employee {
        Employee Number [PK1]
        Employee Name
    }

    class Project {
        Project Number [PK1]
        Project Name
    }

    class `Employee-Project` {
        Employee Number [PK1][FK]
        Project Number [PK1][FK]
    }

    %% Relationship Direction
    Supervisor --> Department
    Department --> `Department-Employee`
    Employee --> `Department-Employee`
    Project --> `Employee-Project`
    Employee --> `Employee-Project`